kwarray.util_robust module
Functions relating to robust statistical methods for normalizing data.
- kwarray.util_robust.find_robust_normalizers(data, params='auto')[source]
Finds robust normalization statistics a set of scalar observations.
The idea is to estimate “fense” parameters: minimum and maximum values where anything under / above these values are likely outliers. For non-linear normalizaiton schemes we can also estimate an likely middle and extent of the data.
- Parameters:
data (ndarray) – a 1D numpy array where invalid data has already been removed
params (str | dict) – normalization params.
When passed as a dictionary valid params are:
- scaling (str):
This is the “mode” that will be used in the final normalization. Currently has no impact on the Defaults to ‘linear’. Can also be ‘sigmoid’.
- extrema (str):
The method for determening what the extrama are. Can be “quantile” for strict quantile clipping Can be “adaptive-quantile” for an IQR-like adjusted quantile method. Can be “tukey” or “IQR” for an exact IQR method.
low (float): This is the low quantile for likely inliers.
mid (float): This is the middle quantlie for likely inliers.
high (float): This is the high quantile for likely inliers.
Can be specified as a concise string.
- The string “auto” defaults to:
dict(extrema='adaptive-quantile', scaling='linear', low=0.01, mid=0.5, high=0.9).- The string “tukey” defaults to:
dict(extrema='tukey', scaling='linear').
- Returns:
normalization parameters that can be passed to
kwarray.normalize()containing the keys:type (str): which is always ‘normalize’
mode (str): the value of
params['scaling']min_val (float): the determined “robust” minimum inlier value.
max_val (float): the determined “robust” maximum inlier value.
- beta (float): the determined “robust” middle value for use in
non-linear normalizers.
- alpha (float): the determined “robust” extent value for use in
non-linear normalizers.
- Return type:
Note
The defaults and methods of this function are subject to change.
Todo
[ ] No (or minimal) Magic Numbers! Use first principles to deterimine defaults.
[ ] Probably a lot of literature on the subject.
[ ] https://www.tandfonline.com/doi/full/10.1080/02664763.2019.1671961
- [ ] This function is not possible to get right in every case
(probably can prove this with a NFL theroem), might be useful to allow the user to specify a “model” which is specific to some domain.
Example
>>> from kwarray.util_robust import *  # NOQA
>>> data = np.random.rand(100)
>>> norm_params1 = find_robust_normalizers(data, params='auto')
>>> norm_params2 = find_robust_normalizers(data, params={'low': 0, 'high': 1.0})
>>> norm_params3 = find_robust_normalizers(np.empty(0), params='auto')
>>> print('norm_params1 = {}'.format(ub.urepr(norm_params1, nl=1)))
>>> print('norm_params2 = {}'.format(ub.urepr(norm_params2, nl=1)))
>>> print('norm_params3 = {}'.format(ub.urepr(norm_params3, nl=1)))
Example
>>> # xdoctest: +REQUIRES(module:scipy)
>>> from kwarray.util_robust import *  # NOQA
>>> from kwarray.distributions import Mixture
>>> import ubelt as ub
>>> # A random mixture distribution for testing
>>> data = Mixture.random(6).sample(3000)
- kwarray.util_robust._tukey_quantile_fence(data, clip=False)[source]
One might wonder where the 1.5 in the above interval comes from – Paul Velleman, a statistician at Cornell University, was a student of John Tukey, who invented this test for outliers. He wondered the same thing. When he asked Tukey, “Why 1.5?”, Tukey answered, “Because 1 is too small and 2 is too large.” [OxfordShapeSpread].
References
- kwarray.util_robust.robust_normalize(imdata, return_info=False, nodata=None, axis=None, dtype=<class 'numpy.float32'>, params='auto', mask=None)[source]
Normalize data intensities using heuristics to help put sensor data with extremely high or low contrast into a visible range.
This function is designed with an emphasis on getting something that is reasonable for visualization.
Todo
[x] Move to kwarray and renamed to robust_normalize?
[ ] Support for M-estimators?
- Parameters:
imdata (ndarray) – raw intensity data
return_info (bool) – if True, return information about the chosen normalization heuristic.
params (str | dict) – Can contain keys, low, high, or mid, scaling, extrema e.g. {‘low’: 0.1, ‘mid’: 0.8, ‘high’: 0.9, ‘scaling’: ‘sigmoid’} See documentation in
find_robust_normalizers().axis (None | int) – The axis to normalize over, if unspecified, normalize jointly
nodata (None | int) – A value representing nodata to leave unchanged during normalization, for example 0
dtype (type) – can be float32 or float64
mask (ndarray | None) – A mask indicating what pixels are valid and what pixels should be considered nodata. Mutually exclusive with
nodataargument. A mask value of 1 indicates a VALID pixel. A mask value of 0 indicates an INVALID pixel. Note this is the opposite of a masked array.
- Returns:
a floating point array with values between 0 and 1. if return_info is specified, also returns extra data
- Return type:
ndarray | Tuple[ndarray, Any]
Note
This is effectively a combination of
find_robust_normalizers()andnormalize().Example
>>> # xdoctest: +REQUIRES(module:scipy)
>>> from kwarray.util_robust import *  # NOQA
>>> from kwarray.distributions import Mixture
>>> import ubelt as ub
>>> # A random mixture distribution for testing
>>> data = Mixture.random(6).sample(3000)
>>> param_basis = {
>>>     'scaling': ['linear', 'sigmoid'],
>>>     'high': [0.6, 0.8, 0.9, 1.0],
>>> }
>>> param_grid = list(ub.named_product(param_basis))
>>> param_grid += ['auto']
>>> param_grid += ['tukey']
>>> rows = []
>>> rows.append({'key': 'orig', 'result': data})
>>> for params in param_grid:
>>>     key = ub.urepr(params, compact=1)
>>>     result, info = robust_normalize(data, return_info=True, params=params)
>>>     print('key = {}'.format(key))
>>>     print('info = {}'.format(ub.urepr(info, nl=1)))
>>>     rows.append({'key': key, 'info': info, 'result': result})
>>> # xdoctest: +REQUIRES(--show)
>>> import seaborn as sns
>>> import kwplot
>>> kwplot.autompl()
>>> pnum_ = kwplot.PlotNums(nSubplots=len(rows))
>>> for row in rows:
>>>     ax = kwplot.figure(fnum=1, pnum=pnum_()).gca()
>>>     sns.histplot(data=row['result'], kde=True, bins=128, ax=ax, stat='density')
>>>     ax.set_title(row['key'])
Example
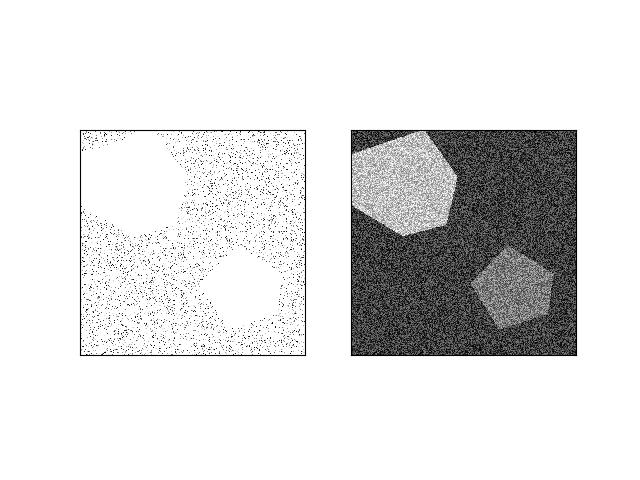
>>> # xdoctest: +REQUIRES(module:kwimage)
>>> from kwarray.util_robust import *  # NOQA
>>> import ubelt as ub
>>> import kwimage
>>> import kwarray
>>> s = 512
>>> bit_depth = 11
>>> dtype = np.uint16
>>> max_val = int(2 ** bit_depth)
>>> min_val = int(0)
>>> rng = kwarray.ensure_rng(0)
>>> background = np.random.randint(min_val, max_val, size=(s, s), dtype=dtype)
>>> poly1 = kwimage.Polygon.random(rng=rng).scale(s / 2)
>>> poly2 = kwimage.Polygon.random(rng=rng).scale(s / 2).translate(s / 2)
>>> forground = np.zeros_like(background, dtype=np.uint8)
>>> forground = poly1.fill(forground, value=255)
>>> forground = poly2.fill(forground, value=122)
>>> forground = (kwimage.ensure_float01(forground) * max_val).astype(dtype)
>>> imdata = background + forground
>>> normed, info = kwarray.robust_normalize(imdata, return_info=True)
>>> print('info = {}'.format(ub.urepr(info, nl=1)))
>>> # xdoctest: +REQUIRES(--show)
>>> import kwplot
>>> kwplot.autompl()
>>> kwplot.imshow(imdata, pnum=(1, 2, 1), fnum=1)
>>> kwplot.imshow(normed, pnum=(1, 2, 2), fnum=1)
- kwarray.util_robust._apply_robust_normalizer(normalizer, imdata, imdata_valid, mask, dtype, copy=True)[source]
Todo
abstract into a scikit-learn-style Normalizer class which can fit/predict different types of normalizers.
- kwarray.util_robust.normalize(arr, mode='linear', alpha=None, beta=None, out=None, min_val=None, max_val=None)[source]
Normalizes input values based on a specified scheme.
The default behavior is a linear normalization between 0.0 and 1.0 based on the min/max values of the input. Parameters can be specified to achieve more general constrat stretching or signal rebalancing. Implements the linear and sigmoid normalization methods described in [WikiNorm].
- Parameters:
arr (NDArray) – array to normalize, usually an image
out (NDArray | None) – output array. Note, that we will create an internal floating point copy for integer computations.
mode (str) – either linear or sigmoid.
alpha (float) – Only used if mode=sigmoid. Division factor (pre-sigmoid). If unspecified computed as:
max(abs(old_min - beta), abs(old_max - beta)) / 6.212606. Note this parameter is sensitive to if the input is a float or uint8 image.beta (float) – subtractive factor (pre-sigmoid). This should be the intensity of the most interesting bits of the image, i.e. bring them to the center (0) of the distribution. Defaults to
(max - min) / 2. Note this parameter is sensitive to if the input is a float or uint8 image.min_val – inputs lower than this minimum value are clipped
max_val – inputs higher than this maximum value are clipped.
- SeeAlso:
find_robust_normalizers()- determine robust parameters fornormalize to mitigate the effect of outliers.
robust_normalize()- finds and applies robust normalizationparameters
References
Example
>>> raw_f = np.random.rand(8, 8)
>>> norm_f = normalize(raw_f)
>>> raw_f = np.random.rand(8, 8) * 100
>>> norm_f = normalize(raw_f)
>>> assert isclose(norm_f.min(), 0)
>>> assert isclose(norm_f.max(), 1)
>>> raw_u = (np.random.rand(8, 8) * 255).astype(np.uint8)
>>> norm_u = normalize(raw_u)
Example
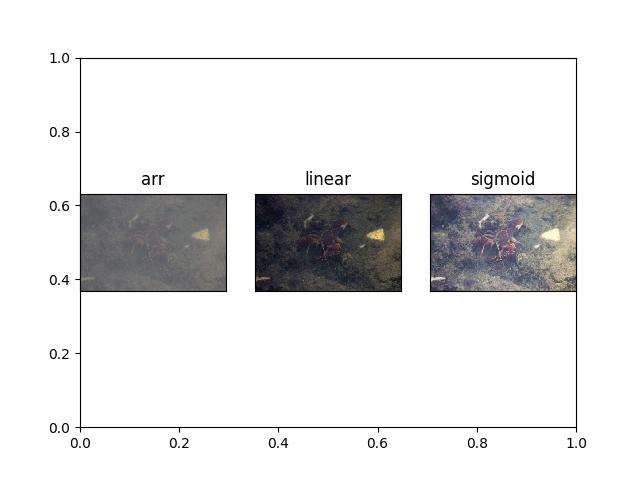
>>> # xdoctest: +REQUIRES(module:kwimage)
>>> import kwimage
>>> arr = kwimage.grab_test_image('lowcontrast')
>>> arr = kwimage.ensure_float01(arr)
>>> norms = {}
>>> norms['arr'] = arr.copy()
>>> norms['linear'] = normalize(arr, mode='linear')
>>> # xdoctest: +REQUIRES(module:scipy)
>>> norms['sigmoid'] = normalize(arr, mode='sigmoid')
>>> # xdoctest: +REQUIRES(--show)
>>> import kwplot
>>> kwplot.autompl()
>>> kwplot.figure(fnum=1, doclf=True)
>>> pnum_ = kwplot.PlotNums(nSubplots=len(norms))
>>> for key, img in norms.items():
>>>     kwplot.imshow(img, pnum=pnum_(), title=key)
Example
>>> # xdoctest: +REQUIRES(module:kwimage)
>>> arr = np.array([np.inf])
>>> normalize(arr, mode='linear')
>>> # xdoctest: +REQUIRES(module:scipy)
>>> normalize(arr, mode='sigmoid')
>>> # xdoctest: +REQUIRES(--show)
>>> import kwplot
>>> kwplot.autompl()
>>> kwplot.figure(fnum=1, doclf=True)
>>> pnum_ = kwplot.PlotNums(nSubplots=len(norms))
>>> for key, img in norms.items():
>>>     kwplot.imshow(img, pnum=pnum_(), title=key)
Benchmark
>>> # Our method is faster than standard in-line implementations for
>>> # uint8 and competative with in-line float32, in addition to being
>>> # more concise and configurable. In 3.11 all inplace variants are
>>> # faster.
>>> # xdoctest: +REQUIRES(module:kwimage)
>>> import timerit
>>> import kwimage
>>> import kwarray
>>> ti = timerit.Timerit(1000, bestof=10, verbose=2, unit='ms')
>>> arr = kwimage.grab_test_image('lowcontrast', dsize=(512, 512))
>>> #
>>> arr = kwimage.ensure_float01(arr)
>>> out = arr.copy()
>>> for timer in ti.reset('inline_naive(float)'):
>>>     with timer:
>>>         (arr - arr.min()) / (arr.max() - arr.min())
>>> #
>>> for timer in ti.reset('inline_faster(float)'):
>>>     with timer:
>>>         max_ = arr.max()
>>>         min_ = arr.min()
>>>         result = (arr - min_) / (max_ - min_)
>>> #
>>> for timer in ti.reset('kwarray.normalize(float)'):
>>>     with timer:
>>>         kwarray.normalize(arr)
>>> #
>>> for timer in ti.reset('kwarray.normalize(float, inplace)'):
>>>     with timer:
>>>         kwarray.normalize(arr, out=out)
>>> #
>>> arr = kwimage.ensure_uint255(arr)
>>> out = arr.copy()
>>> for timer in ti.reset('inline_naive(uint8)'):
>>>     with timer:
>>>         (arr - arr.min()) / (arr.max() - arr.min())
>>> #
>>> for timer in ti.reset('inline_faster(uint8)'):
>>>     with timer:
>>>         max_ = arr.max()
>>>         min_ = arr.min()
>>>         result = (arr - min_) / (max_ - min_)
>>> #
>>> for timer in ti.reset('kwarray.normalize(uint8)'):
>>>     with timer:
>>>         kwarray.normalize(arr)
>>> #
>>> for timer in ti.reset('kwarray.normalize(uint8, inplace)'):
>>>     with timer:
>>>         kwarray.normalize(arr, out=out)
>>> print('ti.rankings = {}'.format(ub.urepr(
>>>     ti.rankings, nl=2, align=':', precision=5)))